Taiwan Tourism's India profile became the most hyper localized, community driven tourism account
THE STARTING POINT
Taiwan wasn't on the Indian traveller's map. At all.
When Typograph took over Taiwan Tourism India's social presence in 2021, the account was an island — posting generic destination content to an audience that simply wasn't engaging. Follower growth had stalled. Indian travelers weren't tagging the page. The content didn't speak to anyone specifically.
What we inherited: Generic, unrelatable destination content not made for Indian travelers. An inactive boosted audience with near-zero organic engagement. No tags or UGC from Indian travelers. No community. No growth. Taiwan as a destination had essentially zero topof-mind recall in the Indian outbound travel market.
THE STRATEGY
Stop talking about Taiwan. Start talking to Indians about Taiwan.
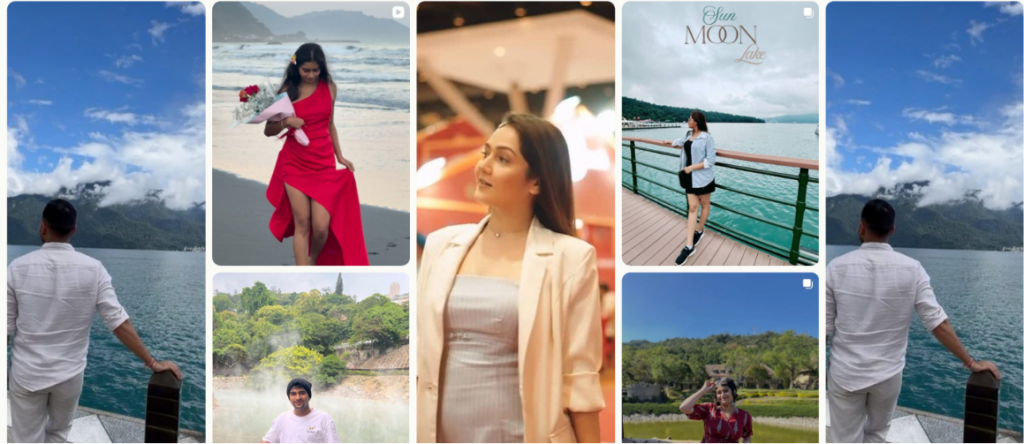
The insight was simple but required patience: in 2021, almost no Indians were traveling to Taiwan, which meant almost no Indian specific content existed. The solution was to find the few who were, celebrate them loudly, and build the community outward from there. Instead of pushing destination content at a passive audience, we flipped the model — we went out to where Indian travelers already were (tagging and engaging on posts about other international destinations) and brought them into the Taiwan conversation.
WHAT WE BUILT
A self-sustaining Indian traveler community around Taiwan.
The shift happened gradually, then decisively. Indian travelers started noticing the page, started tagging it, started reaching out to be featured. What began as us hunting for content became a steady inbound stream — and then a flood.
THE NUMBERS
Four years of compounding organic growth.
Instagram
Organic Only
236%
Average annual click growth
Compounding year-on-year
4.5M
Reach — FY 25–26
66% avg growth every year
3.1M
Views — FY 25–26
100% avg growth every year
100%
Interaction growth
FY 25–26 vs prior year
Facebook
Organic Only
86%
Average annual follower growth
Consistent year-on-year
10.5M
Views — FY 25–26
Organic reach, zero paid boost
55%
Average annual visit growth
Profile and page visits
110%
Interaction growth
FY 25–26 vs prior year
Achieved with minimal spend.
No paid influencer partnerships. No sponsored press trips. Campaign engagement limited to twice-yearly coupon promotions. Every metric above is a product of strategy and community — not budget.
0%
PAID PARTNERSHIPS
THE CONTENT
Real Indians. Real Taiwan.
No paid influencer partnerships. No sponsored press trips. Campaign engagement limited to twice-yearly coupon promotions. Every metric above is a product of strategy and community — not budget.